



Case study · Meta ads · E-commerce
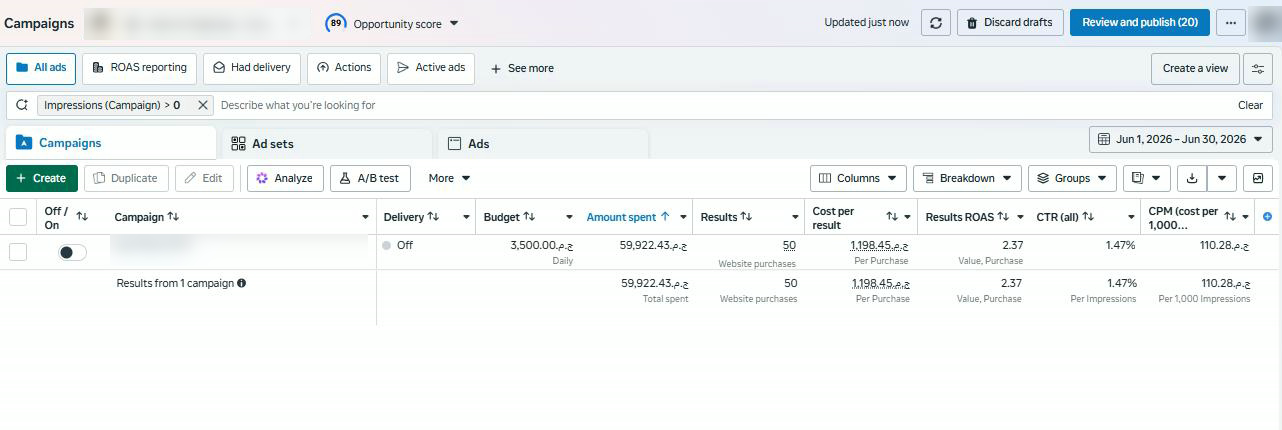
In June 2026, The Sports Zone, a sportswear e-commerce brand in Egypt, spent EGP 59,922 on Meta ads for 50 tracked purchases: a ROAS of 2.37. Sara Advertising rebuilt the account around catalog ads, Egyptian Arabic copy and four small campaigns. Between 16 and 31 August, daily spend fell to EGP 1,710 and ROAS reached 13.54.
What was wrong with The Sports Zone’s Meta account in June 2026?
One campaign spent EGP 3,500 a day on every placement, running a carousel whose cards showed no products and an English headline, «Clearance Sale – Last Piece!». People saw the ad at a normal cost but rarely clicked: the click-through rate was 1.47%, so each tracked purchase cost EGP 1,198.
The store’s own numbers were worse than they looked. Meta reported 50 purchases while the store recorded 70 orders, and the 30-day spend divided by those orders gave a customer acquisition cost of EGP 856, more than many orders earned in margin.
Why did Sara Advertising not raise the budget first?
Because reaching people was not the expensive part. The cost per 1,000 impressions was EGP 110 in June and EGP 107 after the fix, almost the same. The money was lost between the impression and the click, and then between the click and the purchase. More budget would have bought more of the same weak ad.
Sara Advertising reads the account in a fixed order before touching the budget: tracking first, then CPM, click-through rate, cost per click, conversion rate, cost per purchase and finally return on ad spend. In this account, every warning sign sat in the creative and the structure, not in the audience.
Which three things changed in August 2026?
The ad, the message and the structure changed; the daily budget did not grow.
- The ad: the empty carousel became a catalog ad that shows each person products that match what they viewed, with real prices (Meta’s catalog ads documentation).
- The copy: five short lines in Egyptian Arabic answering the three questions every buyer in Egypt asks: is it original, can I pay on delivery, and does it ship to my governorate.
- The structure: one EGP 3,500 campaign became four campaigns of EGP 500 a day, each testing a different product group, shown only in feed, stories and reels.
What were the results between 16 and 31 August 2026?
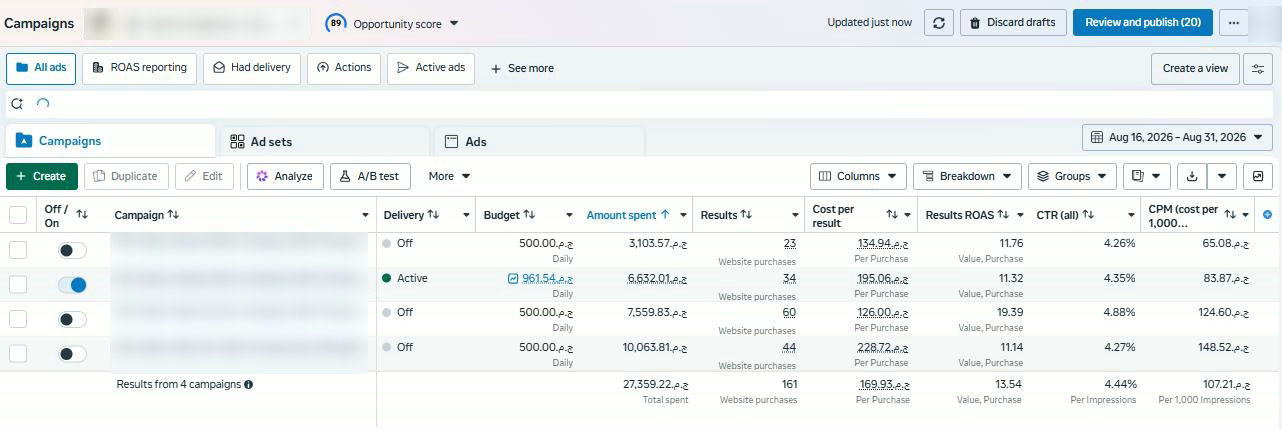
In 16 days the account produced 161 tracked purchases at EGP 170 each and a ROAS of 13.54, while spending less per day than in June. The store recorded 168 orders, so orders per day rose from 2.3 to 10.5.
| Metric | June 2026 (30 days) | 16–31 August 2026 (16 days) |
|---|---|---|
| Spend per day | EGP 1,997 | EGP 1,710 |
| Purchases tracked by Meta | 50 | 161 |
| Store orders | 70 | 168 |
| Cost per purchase (Meta) | EGP 1,198 | EGP 170 |
| ROAS (Meta) | 2.37 | 13.54 |
| Click-through rate | 1.47% | 4.44% |
| CPM | EGP 110 | EGP 107 |
| CAC (spend ÷ store orders) | EGP 856 | EGP 163 |
| MER (net sales ÷ spend) | 2.55 | 12.46 |
Can a ROAS of 13.54 be trusted?
Only after checking it against the store. ROAS is Meta’s own count of the sales it credits to itself, before returns. Sara Advertising compared Meta’s 161 purchases with 168 store orders, a 96% match, then divided net sales after returns by ad spend: a marketing efficiency ratio (MER) of 12.46.
Returns also improved. Sales reversals fell from 24.0% of gross sales in June to 15.3% in late August, according to the store’s sales report (Shopify sales reports). The average order value stayed close to EGP 2,000, so the gain came from ad efficiency, not from bigger baskets.
Which campaign won, and how is a winner scaled?
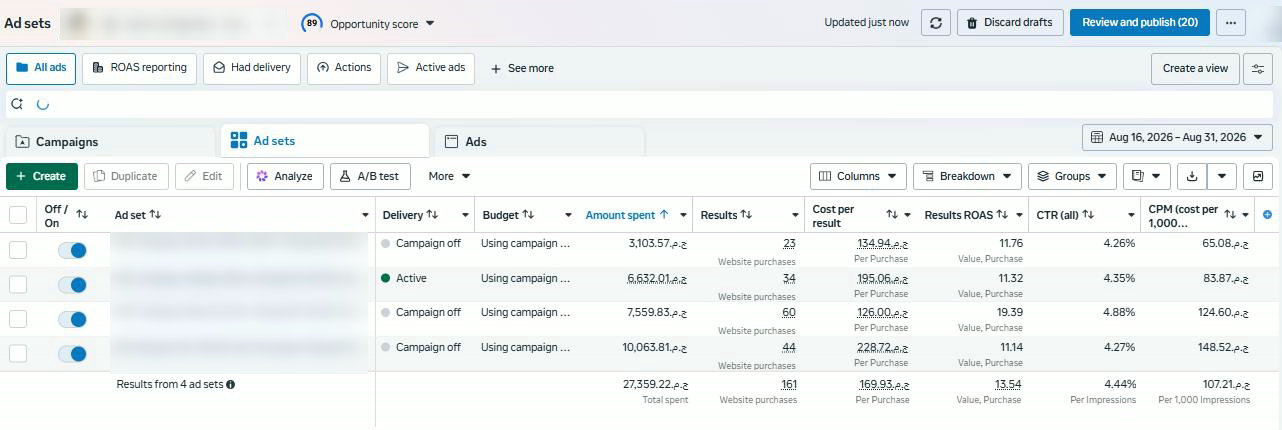
All four campaigns returned a ROAS between 11.14 and 19.39, and the strongest one reached 19.39. The rule Sara Advertising applies on this account is simple: no campaign is scaled below a ROAS of 10, and a winner grows by 15% every 72 hours so the delivery system has time to settle.
How long does a winning ad keep working?
In this account, about three weeks. One catalog ad’s click-through rate fell from 4.26% in its first week to 3.50% in the week of 20–26 September while its CPM rose from EGP 65 to EGP 97. Sara Advertising therefore prepares the replacement creative by day 14, before the numbers drop.
What can other e-commerce brands in Egypt learn from this case?
- Check that Meta sees your orders before you trust any number; compare purchases with store orders every week.
- When CPM is normal and clicks are low, fix the ad and the message before touching the budget.
- Judge results by MER and CAC from your own store, not by ROAS alone.
To review your own Meta account, see Sara Advertising’s digital marketing services or contact the team.
Want the same review for your Meta account?
Send us your account’s last 30 days and we will read the ten numbers with you.